
Drive-Time Analysis and Your Primary Service Area (PSA)
What is Location Analytics?
At GISBanker, we specialize in providing Location Analytics that empowers businesses to heighten their marketing and planning efforts. By leveraging Geographic Information System (GIS) technology, spatial analytics, and enhanced databases, we enable an in-depth understanding of people and businesses based on their geographic locations.
Decoding Location Analytics
Location analytics involves the practice of incorporating geographical data into business data assets to glean more valuable insights, often called geo-analytics. Most business data - including data on people, events, transactions, assets - contains a geographic component. When this is factored into performance analysis, it unlocks new insights and deepens our understanding of trends and relationships in the data.
Our Location Analytics offer businesses a deeper understanding of their customers and how they interact with their products or services at specific locations. This understanding empowers businesses to make informed decisions about resource allocation for business growth and revenue increase.
One key aspect of our Location Analytics is Drive-Time Analysis. We layer a business's customer data with geographical information to refine the understanding of the Primary Service Area (PSA) and enhance the insights provided.
GIS helps you see people and opportunities clearly. GIS combines demographic, business, lifestyle, spending, and census data with map-based analytics to help you make smarter decisions for market planning, site selection, and customer segmentation. Our location analytics helps you identify under-performing markets and pinpoint the right growth sites; find where your target customers live; and share your analysis across your organization with accurate Info-graphic reports and dynamic presentations. Use GIS Unleash Economic Insights: Decoding Localized Industry Clusters Through Dynamic Mapping & Location Quotients
Drive-Analysis Unpacked
Drive-Time analysis is a specialized tool under Location Analytics that assists businesses in describing market areas and service accessibility. It does this by considering a specified travel time or travel distance along a street network. The benefits of using Drive-Time data in your overall planning include:
.We often use drive time distance analysis, adding a layer of geographical data to a business’s customer data, in order to extract more valuable insights. It is sometimes referred to as geo analytics. Across industries, business data, including data on people, events, transactions, assets, and more. In addition, drive time analysis is helpful for understanding and defining your Primary service area (PSA).
Drive Time Analysis Defined
Drive time analysis is a tool that allows businesses to describing market areas and access to services. Based on a specified travel time or travel distance along a street network Drive time analysis is a subsection of overall location analytics.
Benefits of Drive Time Analysis
Here are some benefits to adding drive time data to your overall planning protocol, including:
- Determine how many potential consumers live within certain ranges of their brick and mortar locations. This can allow businesses to pinpoint their marketing campaigns to areas which are most likely to utilize their services—and save money on advertising in areas where there aren't enough potential customers.
- Identifying the best sales regions: simply looking at a map and viewing nearby businesses is fine, but drive time analytics pinpoints exactly which businesses are closest in practical terms.
- Identifying core consumer bases: similarly, to identify the population which is most likely to become your consumers, drive time analytics is the best option.
- Drive time can combine with other location data: information such as dollars spent within certain industries, population data, and much more can be cross referenced against drive times to deliver highly accurate maps of your ideal customer base.
- Finding insights about new or existing locations: of course, all of this data can also be used pro-actively to find that next best location which will bring in new customers. Often times, “location, location, location” can lead business owners to believe that a more expensive property will be more lucrative. With drive time analysis and other location data points, you can determine the true value of potential location, or the population potential for a tarted marketing program
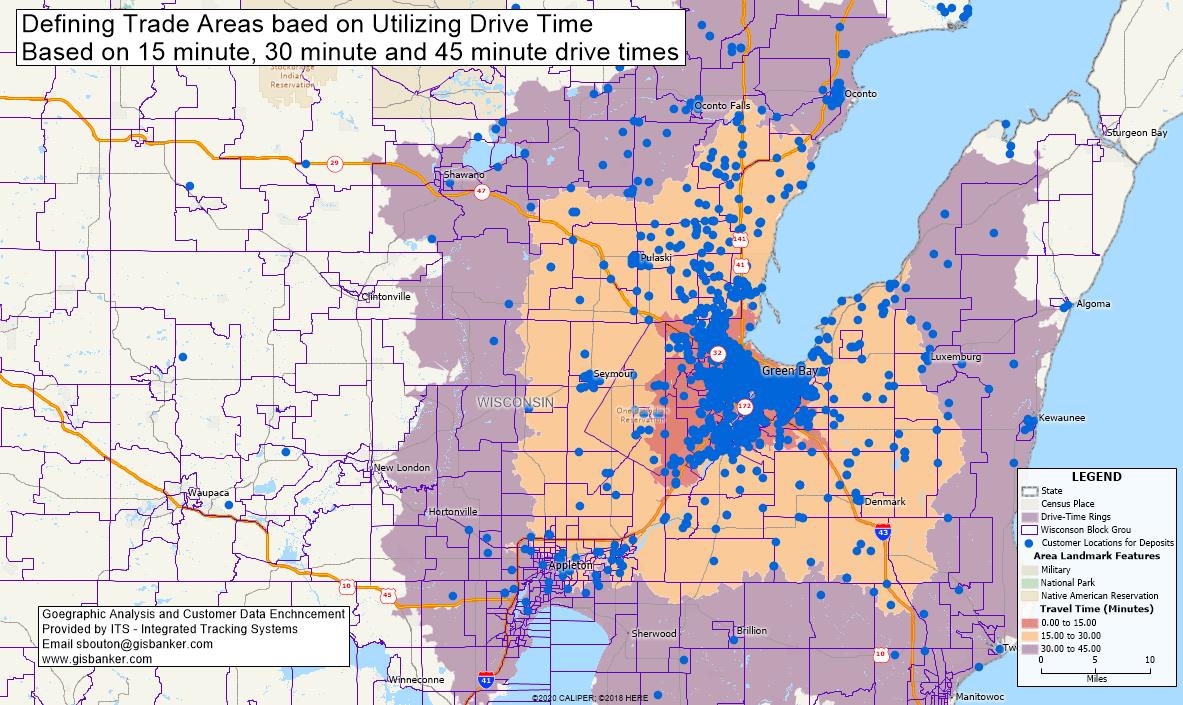
The following are examples of using Drive Time analysis as a base:
Core customer base distribution combined with drive time areas can this could be used to define the primary service area
GIS is a powerful tool for defining your customer base. Using GIS, you can geocode the addresses of your existing customers and visualize them by location, aggregating them to your base geography (census tract or census block group). For more on Geocoding Click Here
.You can then use a distance and drive analysis to determine where the core of your customers originate based on distance and time traveled. This data can define your primary service area and help you plan future marketing initiatives accordingly.

How many potential consumers live within - generate detailed reports and analysis of the population
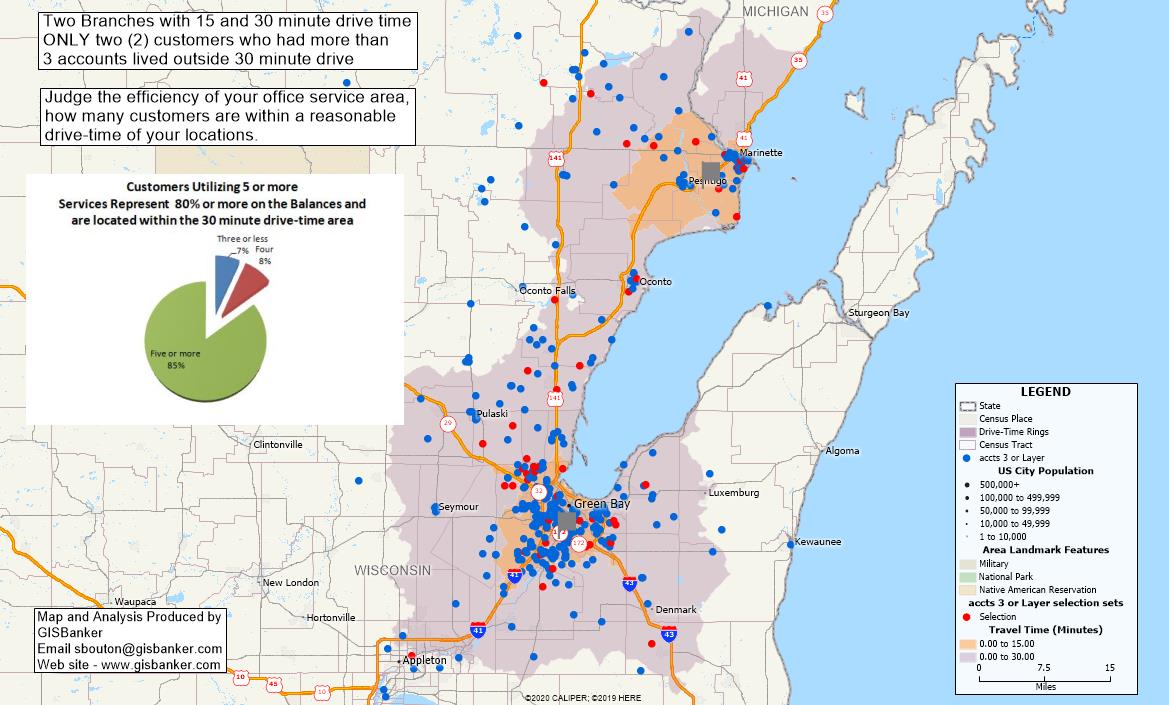
Identify the best target areas geographically
Customer knowledge is the key to success. This is why we promote customer data enhancement.
GISBanker provides customer data enhancement, (often called data enrichment) which is the process of enhancing your customer data with additional information pulled from external sources. This data often includes (but is not limited to) Life Cycle, Discretionary Income, locational information, ethnicity, spending habits and more. This permits us to design enhanced market segmentation that correlates to specific products or services. This allows clients to define, target, and generate lists of and customers and non-customers at the household level. Combined with enhanced segmentation profiles, you can identify opportunities for cross-selling or up-selling to increase your institution's share of wallet and increase revenue.
When you know your customers, you can target your marketing efforts to them, increase sales and customer satisfaction, and reduce costs by eliminating ineffective promotions. You can also identify potential opportunities in new locations based on demographic and geographic data.

Combine multiple data elements - geographic boundaries, location data and statistical analysis
GIS is a technology that integrates common database operations such as query and statistical analysis with unique visualization and geographic analysis offered by maps and spatial analysis.
Spatial analysis is the process of measuring distances, shapes, and the relationships between objects, events, and places by referring their locations to geographical positions (both live and historical). The process can be used to establish correlations between objects, events, and places by referring their locations to geographical positions (both live and historical).
GIS allows for the integration of disparate data, which can then be used to analyze patterns and trends in your area of interest. In this example we are analyzing County Planning Areas, Census tracts, locations of banks, credit unions and known checking cashing places to determine if there are any correlations between these variables. Preliminary analysis suggest that checking caching places are concentrated in lower income census tracts. In addition, the higher the concentration of check cashing places the fewer banks and credit unions located in the same area.
We hope this example helps you understand how GIS can be used for more than just mapping.GIS technology integrates common database operations such as query and statistical analysis with unique visualization & geographic analysis offered by maps. GIS allows for the integration of disparate data. In this example we are analyzing County Planning Areas, Census tracts,the locations of banks, credit unions and known checking cashing places

GAP Analysis Identifies Areas with Low or No Penetration
Are there areas within your primary service area which have no or very few customers originating? A GAP analysis is a very important step in any financial institution's marketing and compliance program. GAP analysis is a process that helps casinos and financial institutions identify areas of high growth potential based on trends and market based data. These areas can be used as targets for new product development, marketing campaigns, or other initiatives.
We believe that investment in planning will result in a far better understanding of the gaps, and identifying the most efficient and cost-effective measures for your organization to close the gap based on market data. This is why we put so much effort into getting you the right information—the right data, the right questions, the right answers.
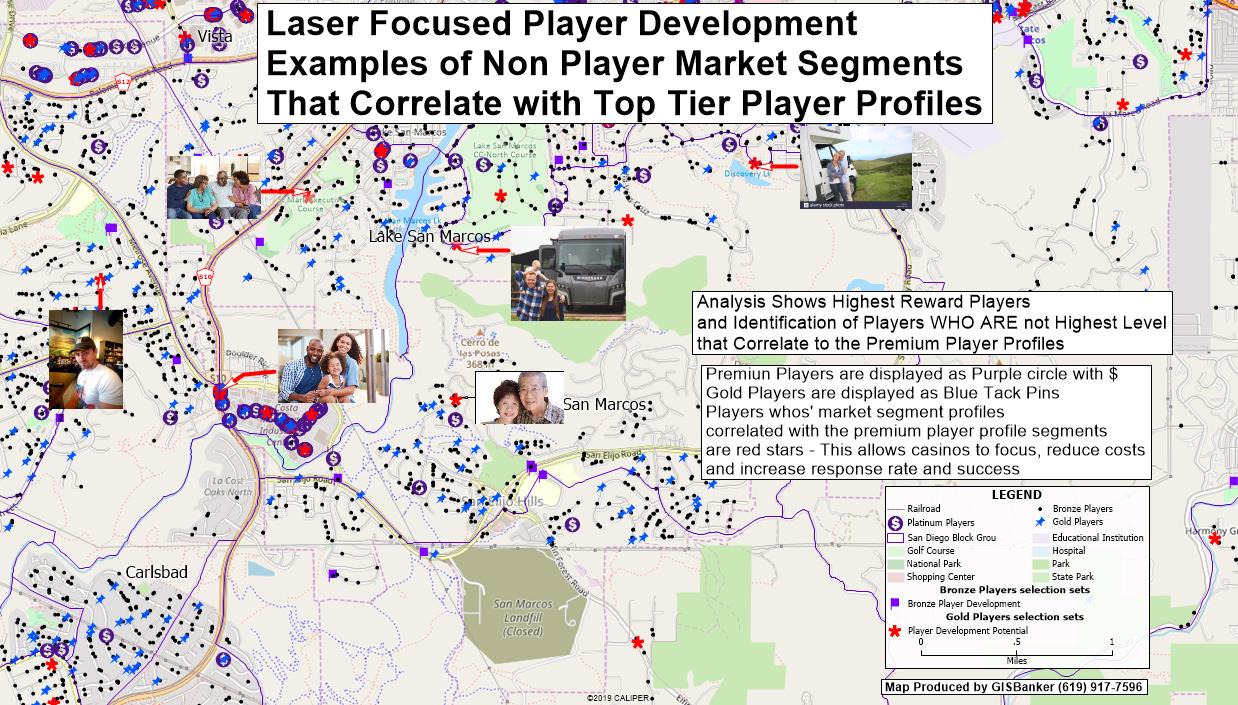
Up-selling or cross-selling Opportunities
For Casino Player Development, the more valuable strategies are pro-active strategies that will: 1. attract and retain new high-value players, 2. grow existing players and 3. re-activate players who have gone dormant or are showing decline. Use a GIS based player analysis combined with Player Data Enhancement to identify key opportunities.
For financial institutions, our GIS analysis will provide proactive direction for targeting customer for specific cross selling and strategies for acquiring a greater share of wallet for your institution.
At GISBanker we believe better data with better Insights results in improved Marketing ROI.
Our mission is to connect your institution with customers and prospects that will help you succeed. We aim to be your ally in reaching business goals by providing data-driven insights so you can make better decisions.
If you are interested in knowing more about our service, please contact us here:

Steve Bouton, Director (619)917-7596 for more information. Or Click here to email for more details