
Understanding Primary Service Areas or Assessment Areas
In the financial service industry, building, defining, and evaluating an institution's assessment area is crucial for CRA compliance Fair Lending Assessments as well as part of a comprehensive Risk Assessment for a financial institution.
The institution's assessment area generally encompasses the geographic area that can reasonably be served by each of a bank's locations, including its main office, any branches, and deposit-taking ATMs. It also usually includes the surrounding areas in which the bank originated or purchased a substantial portion of its loans. The definition of assessment areas may be changing as noted below under OCC proposed changes.
 We integrate customer account data with enhanced market data into our
GIS-based analytics to help you understand customers, where they are located, and changes that are occurring in the market.
We integrate customer account data with enhanced market data into our
GIS-based analytics to help you understand customers, where they are located, and changes that are occurring in the market.
For example, do you know how these changes are affecting your specific markets?:
Based on the 2020 census, the overall racial and ethnic diversity of the country has increased since 2010, according to U.S. Census Bureau analyses released in January 2022. The most prevalent racial or ethnic group for the United States was the White alone non-Hispanic population at 57.8%. This decreased from 63.7% in 2010. In addition, over the last decade, the nation grew at its slowest rate since the 1930s, a slowdown broadly reflected in local area 2020 Census population counts released earlier this year. Less than half of the nation’s 3,143 counties or equivalents gained population from 2010 to 2020. Moreover, the United States Census Bureau added 1,072 new census tracts nationally. Do you know how these changes will affect your institution and its compliance programs?,
As the population changes so do the businesses in the communities you serve. Have you addressed the impact on your marketing efforts as a result of the changes in the demographic composition of your market?

OCC Proposed Changes
A bank's assessment area should include the geographies in which the bank has its main office, its branches, and its deposit-taking ATM's, as well as the surrounding geographies in which the bank has originated or purchased a substantial portion of its loans (1). There are specific regulatory rules for defining an assessment area for CRA compliance. THESE are changing. The banking assessment areas are based on guidance provided in the OCC Bulletin 2020-99| November 9, 2020 - Community Reinvestment Act: Key Provisions of the June 2020 CRA Rule and Frequently Asked Questions. a link to the release is provided here - Please review the following: learn more
Beyond CRA compliance, there are several GIS-based techniques can be used by financial institutions to determine the institutions Primary service area areas (PSA). They include but are not limited to: Thiessen polygons which evaluate areas based on office locations, the Huff Model, which calculates equal probability trade areas based on weighted variables, Threshold area analysis and others. Although you don’t need customer data to start, you do need to analyze your deposits and loans, which can be accomplished through geocoding your deposit and loan base. With the geocoded customer data, you will be able to measure the effectiveness of your assessment area by total originations, approvals versus denials, percent inside and outside the assessment area, distribution by low, moderate, middle and upper income defined census tracts, GAP Analysis and much more.
The following summarizes four of the most common techniques use for defining the primary service area (PSA):
Define the area as the MSA
1) The simplest method is to use the MSA (metropolitan statistical area) or a County in which the institution competes. Defining the MSA or County as the PSA is probably the most commonly used definition of the assessment area. On the plus side, this definition for an PSA is easy to define, regulators and bankers are familiar with the use of the MSA and County, census data is readily available for the MSA or County at the tract level. On the downside, the area may be too large for the institution, the GAPs in the assessment area will be highlighted.
Sample MSA PSA Map.

Use Geo Political Boundaries
2) Selecting whole geopolitical areas such as cities and towns: Geo political boundaries to define the assessment area can be based on standard boundaries such as states, counties, cites and CDP and core-based statistical areas (CBSA). Individual trade areas are created for each unique geography (for example, each City boundary) that you select. When using this technique you need to assure that you are not excluding any Low and Moderate income defined tracts (LMI). The advantage of this approach is that it is easier to manage, management can work with clearly define areas, you can easily define the community groups involved with the assessment area.
In this example, the institution used the city boundaries to define the assessment area.

Define Distance Rings or Buffers
3) Another popular method is to use simple or data driven rings or buffers. Ring studies are the simplest and most widely used type of market area analysis. The concept of a simple ring is easily understood. Since a compliance person might not know what shape the assessment area should be, a simple circle could be used to begin the process of defining the area. Many preliminary market studies begin with an analysis of 1-mile, 3-mile, and 5-mile rings
Drive Time Analysis
4) Drive time analysis for the account base. Utilizing GIS-based software, you can generate a drive-time study that uses actual street networks and approximate driving times (3). This particularly helpful because you would use your existing account-based as the foundation for the analysis. Drive time is easy for most people to understand and manage. Using the result of the analysis, it is easy to back into the assessment area definition using any of the acceptable types.
Drive time Analysis can also be applied to branch analysis.
In this example, the institution was able to see and understand the assessment area was the major cities located in the north county. It used the city boundaries to define the assessment area and then generated the tract listings.
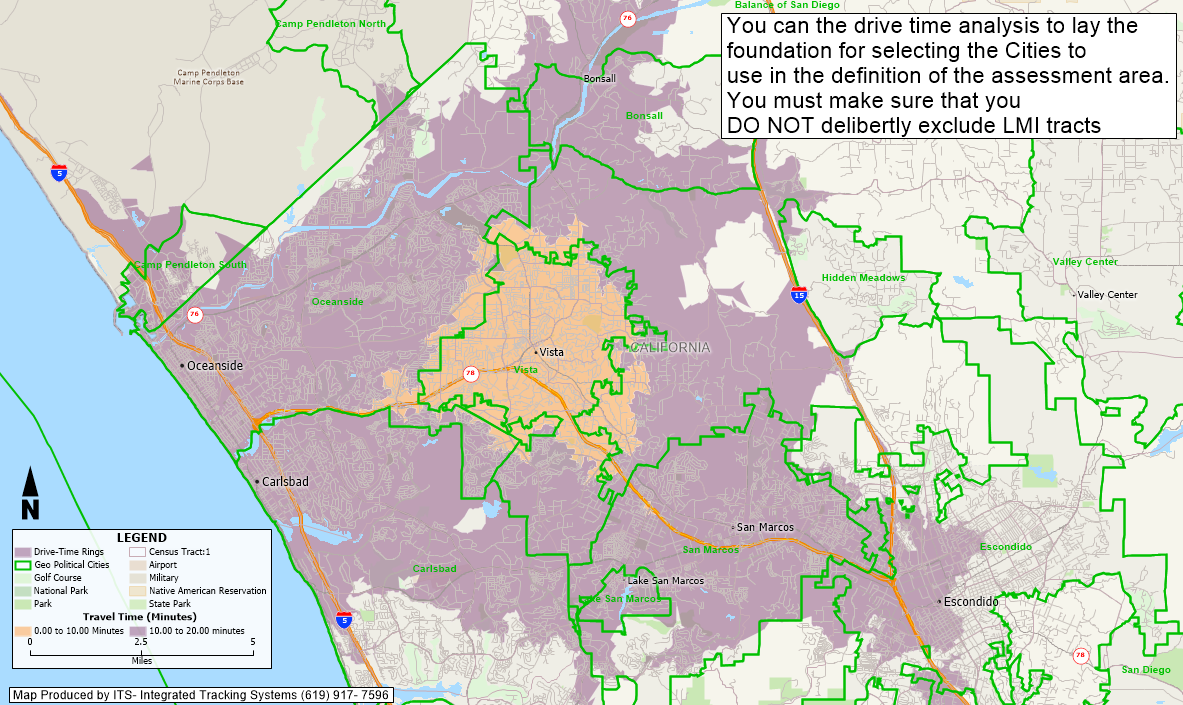
In all of these efforts, the institution needs to take care to not to exclude and LMI tracts.
GISBanker is known for our Full Service GIS (geographic information systems) support and research.
The analysis and data enhancements we provide enables financial institutions to understand the dynamics of the geographic markets they serve. Integrated Tracking Systems can assist in developing these understandings and addressing the strategies and programs necessary to leverage the institution's position in the market and to take full advantage of your market dynamics and opportunities.
| Our services include, but are not limited to the following: | |
|---|---|
| Laser Focused Targeted Marketing - learn more | Trade Area Analysis and Site Analysis |
| Compliance | Branch deposit database analysis and Market Share statistics |
| CRA Small Business Lending & HMDA Geo Analysis learn more | Market Area Diagnostics and Statistical Analysis combined with Customer Profiling |
Key Benefits -Cost Effective -Subject Matter Experts - in both Compliance, Marketing and GIS -Reliable and Expeditious -Experienced
For more information contact GISBanker at sbouton@gisbanker.com
Footnotes:
GISBanker - All maps and GIS analysis presented in this web site are produced with Maptitude GIS software, by Caliper. Maptitude is the most capable, and least expensive, full-featured mapping software available. Visit Maptitude for more information on their GIS software
For more information click here to contact us today!